
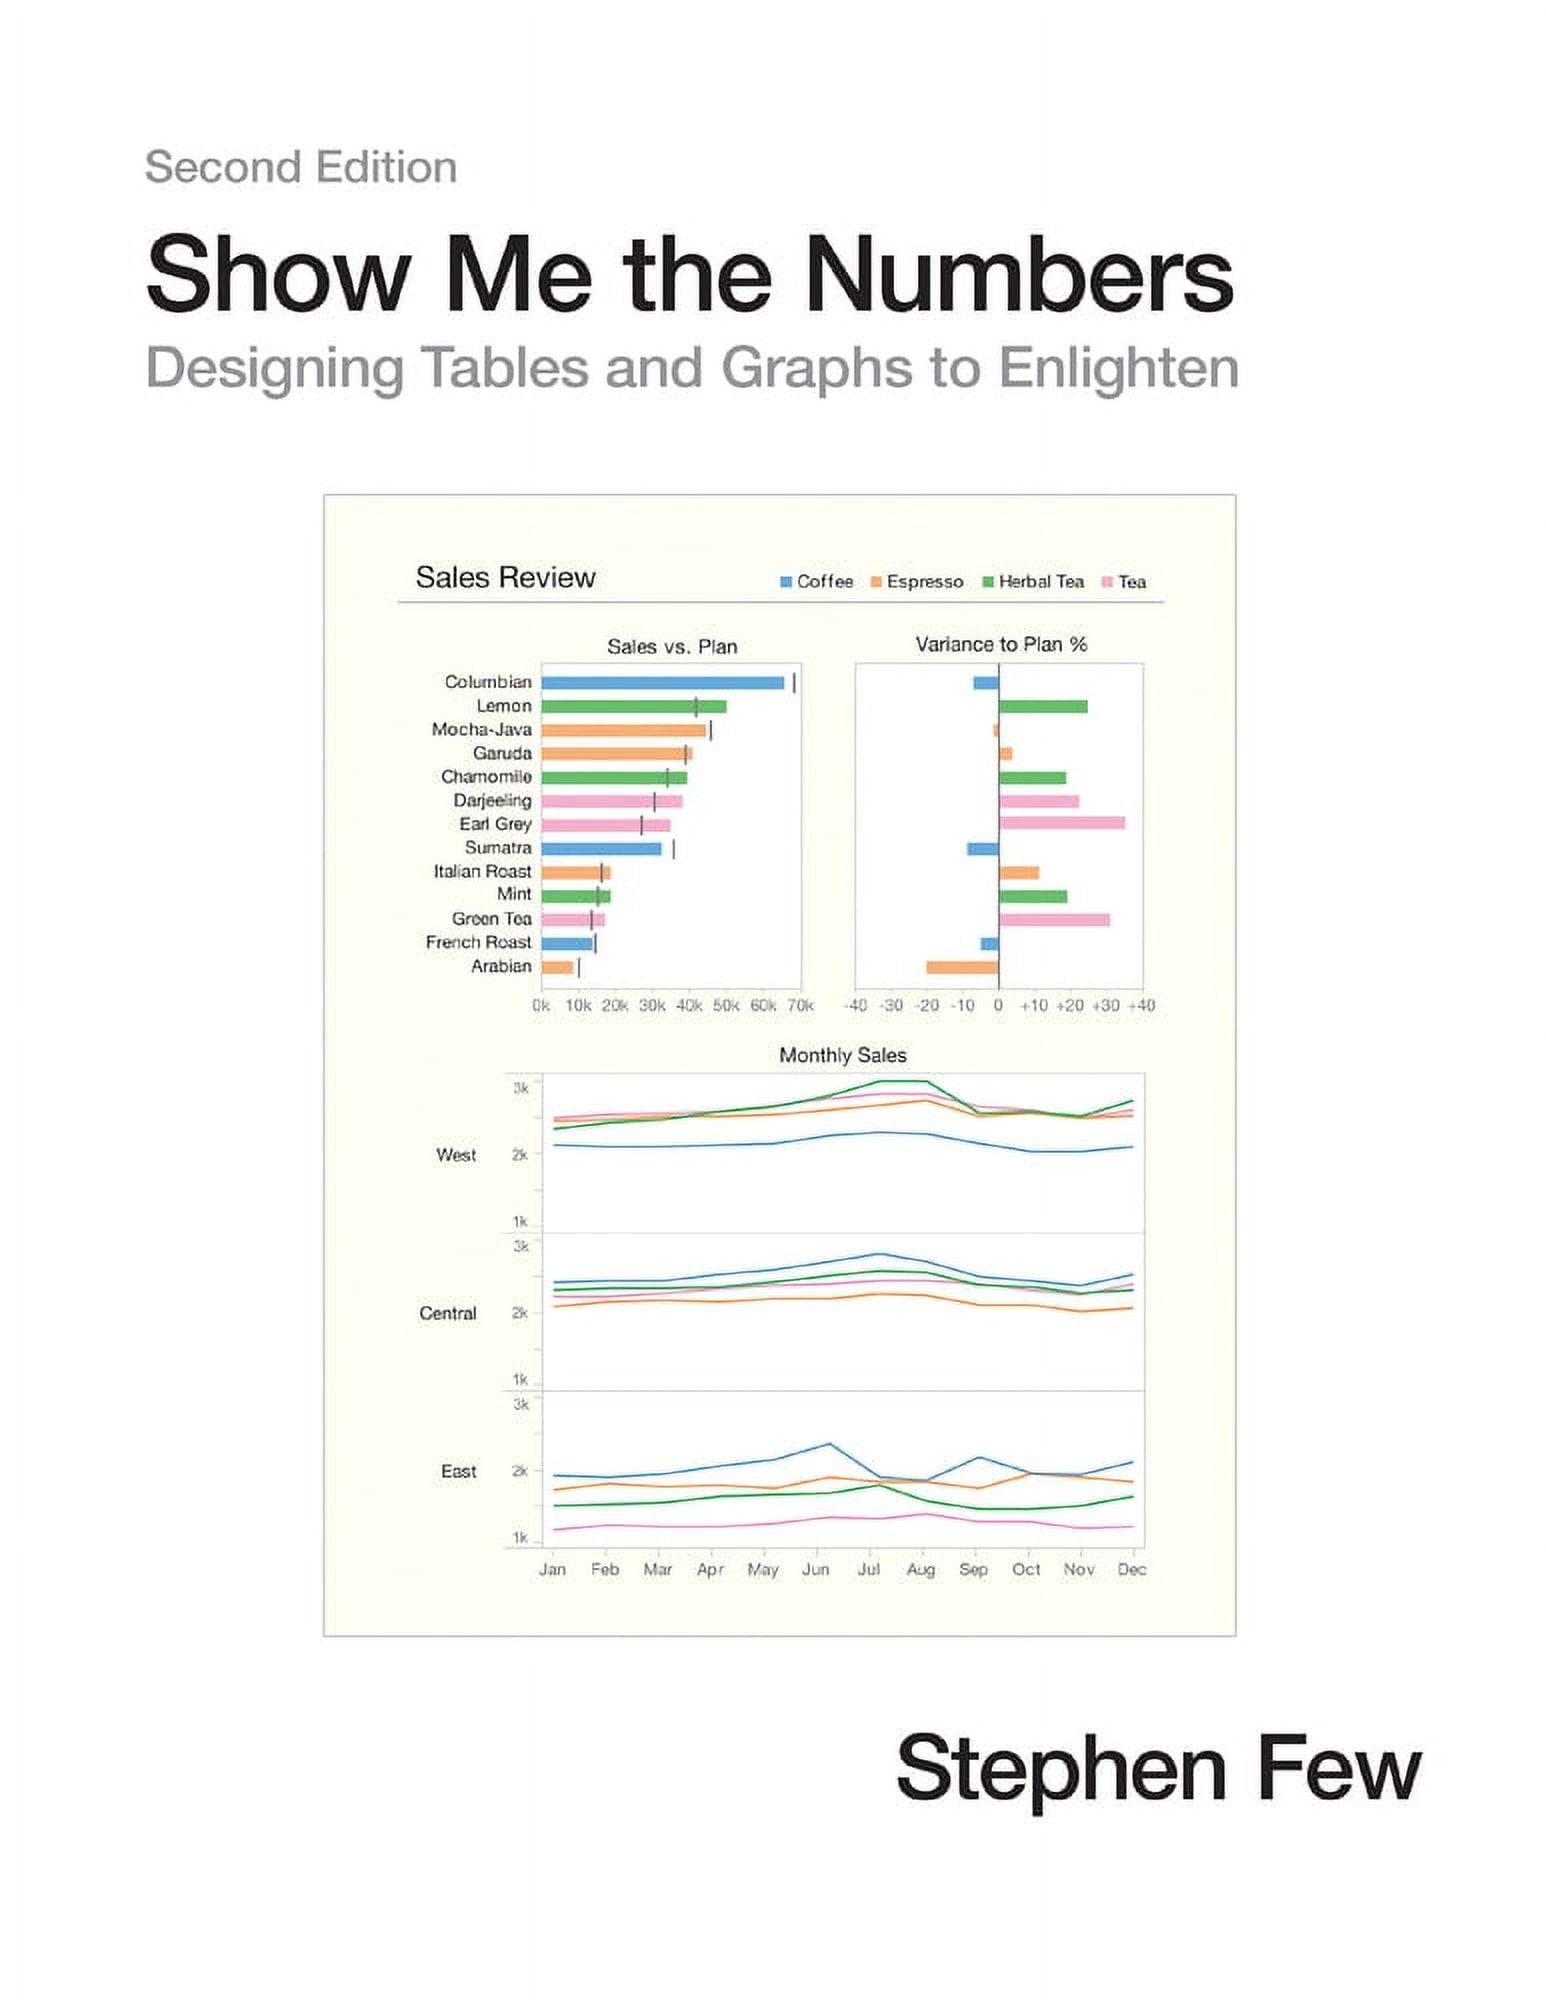
Show Me the Numbers : Designing Tables and Graphs to Enlighten (Edition 2) (Hardcover)
Product details
| Management number | 238096268 | Release Date | 2026/07/11 | List Price | US$8.55 | Model Number | 238096268 | ||
|---|---|---|---|---|---|---|---|---|---|
| Category | |||||||||
Addressing the prevalent issue of poorly designed quantitative information presentations, this accessible, practical, and comprehensive guide teaches how to properly create tables and graphs for effective and efficient communication. The critical numbers that measure the health, identify the opportunities, and forecast the future of organizations are often misrepresented because few people are trained to design accurate, informative materials, but this manual helps put an end to misinformation. This revised edition of the highly successful book includes updated figures and 91 additional pages of content, including new chapters about quantitative narrative and current misuses of graphs--such as donut, circle, unit, and funnel charts--and new appendices that cover constructing table lens displays and box plots in Excel and useful color palettes for presentation materials.
Addressing the prevalent issue of poorly designed quantitative information presentations, this accessible, practical, and comprehensive guide teaches how to properly create tables and graphs for effective and efficient communication. The critical numbers that measure the health, identify the opportunities, and forecast the future of organizations are often misrepresented because few people are trained to design accurate, informative materials, but this manual helps put an end to misinformation. This revised edition of the highly successful book includes updated figures and 91 additional pages of content, including new chapters about quantitative narrative and current misuses of graphs—such as donut, circle, unit, and funnel charts—and new appendices that cover constructing table lens displays and box plots in Excel and useful color palettes for presentation materials.| Book format | Hardcover |
|---|---|
| Fiction/nonfiction | Non-Fiction |
| Genre | Textbooks |
| Publication date | June, 2012 |
| Pages | 371 |
| Reading level | General |
| Subgenre | Graphic Methods |
| Series title | No Series |
| Number in series | 0 |
| Edition | 2nd Edition |
| Publisher | Analytics Press |
| Original languages | English |
| Language | English |
| Edu focus | Mathematics |
| Is collectible | N |
| Binding type | Case Binding |
| Retail packaging | Single Piece |
| Assembled product height | 11.2 in |
| Assembled product weight | 3.52 lb |
| Bisac subject heading | Mathematics |
Bestseller ranking
All Books





Customers who viewed this product also viewed
Godzilla


Correction of product information
If you notice any omissions or errors in the product information on this page, please use the correction request form below.
Correction Request Form